
 U.S. coin production slowed and registered under 1 billion for a second month in a row, according to United States Mint manufacturing figures for April.
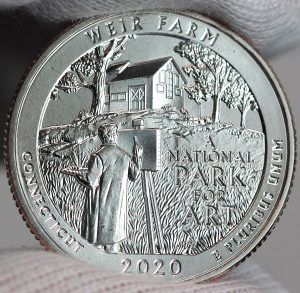
U.S. Mint data also revealed mintages for Connecticut’s Weir Farm National Historic quarter, the second of this year’s five quarters with unique designs.
In the headline figure for the month, the Mint produced just over 801 million coins for circulation — spread across nickels, dimes, and quarters, marking declines of 10.8% from March and 36.1% from April 2019.
The Variety & Errors Master Guide
Get the comprehensive, offline guide to coin varieties and errors. Perfect for your next coin show or estate sale.
Get the Digital Guide →Here’s how the month ranks against others in the past year:
April 2019 to April 2020 Circulating Coin Production
Month |
Mintages |
Rank |
April 2020 |
801.84 M |
10 |
March 2020 |
898.86 M |
8 |
February 2020 |
1,094.30 M |
5 |
January 2020 |
1,228.08 M |
2 |
December 2019 |
400.88 M |
13 |
November 2019 |
898.38 M |
9 |
October 2019 |
1,154.94 M |
4 |
September 2019 |
939.66 M |
7 |
August 2019 |
767.32 M |
11 |
July 2019 |
1,202.10 M |
3 |
June 2019 |
1,021.654 M |
6 |
May 2019 |
485.24 M |
12 |
April 2019 |
1,253.76 M |
1 |
The Federal Reserve orders more 1-cent coins than any other denomination despite data that shows it costs the U.S. Mint 1.99 cents to make and distribute each one. The Mint produced 403.2 million Lincoln cents last month, for 50.3% of the circulating-quality coins produced in April.
Month-Over-Month
In month-over month comparisons for coins used daily by Americans, production totals in April saw:
- 20.8% fewer Lincoln cents,
- 18.9% fewer Jefferson nickels,
- 61.6% more Roosevelt dimes, and
- 30% fewer America the Beautiful quarter dollars.
Native American $1 Coins and Kennedy half-dollars are no longer ordered by Federal Reserve Banks but they are still made in circulating quality for coin collectors. Usually in January, the U.S. Mint tends to strike both coins to the expected amounts needed for the entire year. That wasn’t the case for halves at least until the second month of this year.
In February, mintages of Philadelphia Mint-struck Kennedy half-dollars rose by 1.8 million after none were reported out of the plant in January. That adds to the earlier 1.8 million produced Denver halves for a combined 3.6 million. Last year’s half-dollar ended with equal splits of 1.7 million for Denver and Philadelphia for a combined 3.4 million.
Published mintages of the Native American dollar remained unchanged — 1.26 million from Denver and 1.4 million from Philadelphia for a combined 2.66 million coins. Last year’s dollar had splits of 1.54 million for Denver and 1.4 million for Philadelphia for a combined 2.94 million coins.
Here’s a summary of all circulating-quality coins produced last month:
US Mint Circulating Coin Production in April 2020
Denomination |
Denver |
Philadelphia |
Total |
Lincoln Cents |
208,400,000 |
194,800,000 |
403,200,000 |
Jefferson Nickels |
33,360,000 |
31,680,000 |
65,040,000 |
Roosevelt Dimes |
107,000,000 |
99,000,000 |
206,000,000 |
ATB Quarters |
66,000,000 |
61,600,000 |
127,600,000 |
Kennedy Half Dollars |
0 |
0 |
0 |
Native American $1s |
0 |
0 |
0 |
Total |
414,760,000 |
387,080,000 |
801,840,000 |
U.S. Mint plants in Denver and Philadelphia manufacture all of America’s coins for commerce. Last month, the Denver Mint made 414.76 million coins and the Philadelphia Mint made 387.08 million coins for the combined 801.84 million coins.
Year-to-date, the Denver Mint struck 2,120,360,000 coins and the Philadelphia Mint struck 1,902,720,000 coins for a combined 4,023,080,000 coins — 20.7% fewer than the 5,072,060,000 coins minted through the first four months of 2019.
This next table lists 2020 coin production totals by denomination and by U.S. Mint facility:
YTD 2020 Circulating Coin Production by Denomination
| 1 ¢ | 5 ¢ | 10 ¢ | 25 ¢ | 50 ¢ | N.A. $1 | Total: | |
|---|---|---|---|---|---|---|---|
| Denver | 1158.8M | 202.8M | 333.5M | 422.2M | 1.8M | 1.26M | 2120.36M |
| Philadelphia | 1029.6M | 160.32M | 316M | 393.6M | 1.8M | 1.4M | 1902.72M |
| Total | 2188.4M | 363.12M | 649.5M | 815.8M | 3.6M | 2.66M | 4023.08M |
If the current production pace stretched through to December, the annual mintage for 2020 would near 12.1 billion coins. Usually, however, the production pace slows significantly in December as the Mint prepares for newly dated coinage for the upcoming year. The U.S. Mint made over 11.9 billion coins for circulation in 2019.
Mintages by Unique Design
The U.S. Mint has released to date three annually issued coins with one-year-only designs. They include:
- the 2020 National Park of American Samoa quarter, which launched on Feb. 3,
- the 2020 Native American dollars, released on Feb. 12, and
- the Weir Farm National Historic Site quarter for Connecticut, which launched into circulation on April 6.
The following table offers a mintage breakdown for it and other denominations:
2020 Circulating Coin Production by Design
Denver |
Philadelphia |
Total |
|
Lincoln Cents |
1,158,800,000 |
1,029,600,000 |
2,188,400,000 |
Jefferson Nickels |
202,800,000 |
160,320,000 |
363,120,000 |
Roosevelt Dimes |
333,500,000 |
316,000,000 |
649,500,000 |
National Park of American Samoa Quarter |
212,200,000 |
249,200,000 |
461,400,000 |
Weir Farm National Historic Site Quarter (Connecticut) |
135,400,000 |
113,200,000 |
248,600,000 |
Salt River Bay National Historical Park and Ecological Preserve Quarter (U.S. Virgin Islands) |
0 |
0 |
0 |
Marsh-Billings-Rockefeller National Historical Park Quarter (Vermont) |
0 |
0 |
0 |
Tallgrass Prairie National Preserve Quarter (Kansas) |
0 |
0 |
0 |
Kennedy Half-Dollars |
1,800,000 |
1,800,000 |
3,600,000 |
Native American $1 Coins |
1,260,000 |
1,400,000 |
2,660,000 |
Total |
2,045,760,000 |
1,871,520,000 |
3,917,280,000 |
There are 105.8 million in quarters that the U.S. Mint has yet to officially assign to a design. These are a portion of the U.S. Virgin Islands’ Salt River Bay quarters set to enter circulation on June 1.
Popular Variety & Errors Topics:
- What are Error Coins?
- How Much is Your Money Worth?
- Variety and Error Coin Price Guide
- US Mint Price and Proof Set Guide
- Paper Money Price Guide
- Old Banknote Values and Price Guide
- Videos on Currency
ALSO CHECK OUT OUR PAGES WITH:
Currency Converter
International currency converter – Exchange rates for up to 164 currencies and three different precious metals to include gold, silver and platinum.
Coin Shows, Auctions & PR Events
Pretty obvious, it’s a link to shows and events around you!
VarietyErrors
Sign up for FREE News, Videos and Articles!

Comments are closed